
In the design of the photovoltaic power station system, the ratio of the installed capacity of the photovoltaic modules to the rated capacity of the inverter is DC/AC Power Ratio,
Which is a very important design parameter.In the “Photovoltaic Power Generation System Efficiency Standard” released in 2012, the capacity ratio is designed according to 1:1, but due to the influence of light conditions and temperature, the photovoltaic modules cannot reach the nominal power most of the time, and the inverter basically All are running at less than full capacity, and most of the time is in the stage of wasting capacity.
In the standard released at the end of October 2020, the capacity ratio of photovoltaic power plants was fully liberalized, and the maximum ratio of components and inverters reached 1.8:1. The new standard will greatly increase the domestic demand for components and inverters. It can reduce the cost of electricity and accelerate the arrival of the era of photovoltaic parity.
This paper will take the distributed photovoltaic system in Shandong as an example, and analyze it from the perspective of the actual output power of photovoltaic modules, the proportion of losses caused by over-provisioning, and the economy.
01
The trend of over-provisioning of solar panels
—
At present, the average over-provisioning of photovoltaic power plants in the world is between 120% and 140%. The main reason for over-provisioning is that the PV modules cannot reach the ideal peak power during the actual operation. The influencing factors include:
1).Insufficient radiation intensity (winter)
2).Ambient temperature
3).Dirt and Dust Blocking
4).Solar module orientation is not optimal throughout the day (tracking brackets are less of a factor)
5).Solar module attenuation: 3% in the first year, 0.7% per year thereafter
6).Matching losses within and between strings of solar modules
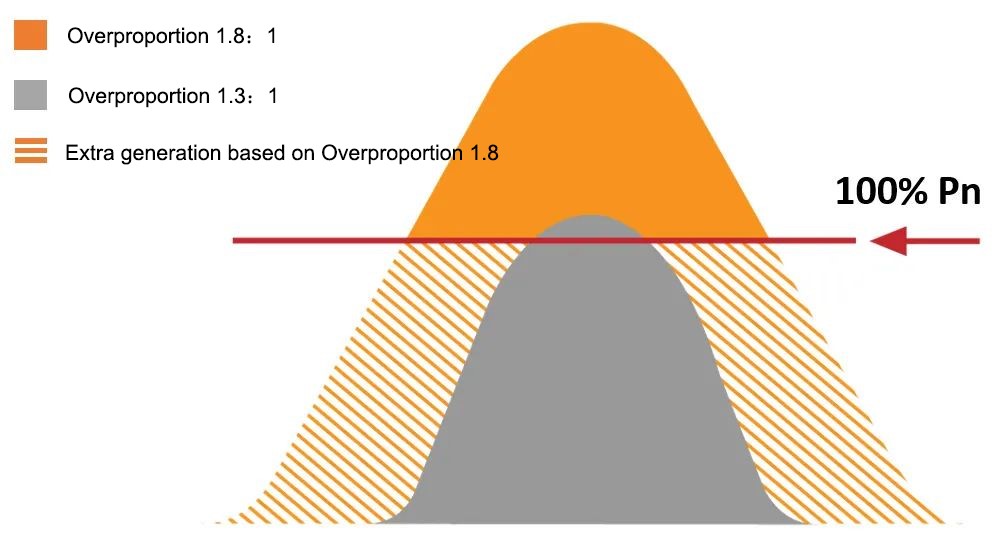
Daily power generation curves with different over-provisioning ratios
In recent years, the over-provisioning ratio of photovoltaic systems has shown an increasing trend.
In addition to the reasons for system loss, the further decline of component prices in recent years and the improvement of inverter technology have led to an increase in the number of strings that can be connected, making over-provisioning more and more economical.In addition, the over-provisioning of components can also reduce the cost of electricity, thereby improving the internal rate of return of the project, so the anti-risk ability of the project investment is increased.
In addition, high-power photovoltaic modules have become the main trend in the development of the photovoltaic industry at this stage, which further increases the possibility of over-provisioning of components and the increase of household photovoltaic installed capacity.
Based on the above factors, over-provisioning has become the trend of photovoltaic project design.
02
Power generation and cost analysis
—
Taking the 6kW household photovoltaic power station invested by the owner as an example, LONGi 540W modules, which are commonly used in the distributed market, are selected. It is estimated that an average of 20 kWh of electricity can be generated per day, and the annual power generation capacity is about 7,300 kWh.
According to the electrical parameters of the components, the working current of the maximum working point is 13A. Choose the mainstream inverter GoodWe GW6000-DNS-30 on the market. The maximum input current of this inverter is 16A, which can adapt to the current market. high current components. Taking the 30-year average value of the annual total radiation of light resources in Yantai City, Shandong Province as a reference, various systems with different over-proportion ratios were analyzed.
2.1 system efficiency
On the one hand, over-provisioning increases the power generation, but on the other hand, due to the increase of the number of solar modules on the DC side, the matching loss of the solar modules in the solar string and the loss of the DC line increase, so there is an optimal capacity ratio, maximize the efficiency of the system. After PVsyst simulation, the system efficiency under different capacity ratios of the 6kVA system can be obtained. As shown in the table below, when the capacity ratio is about 1.1, the system efficiency reaches the maximum, which also means that the utilization rate of the components is the highest at this time.
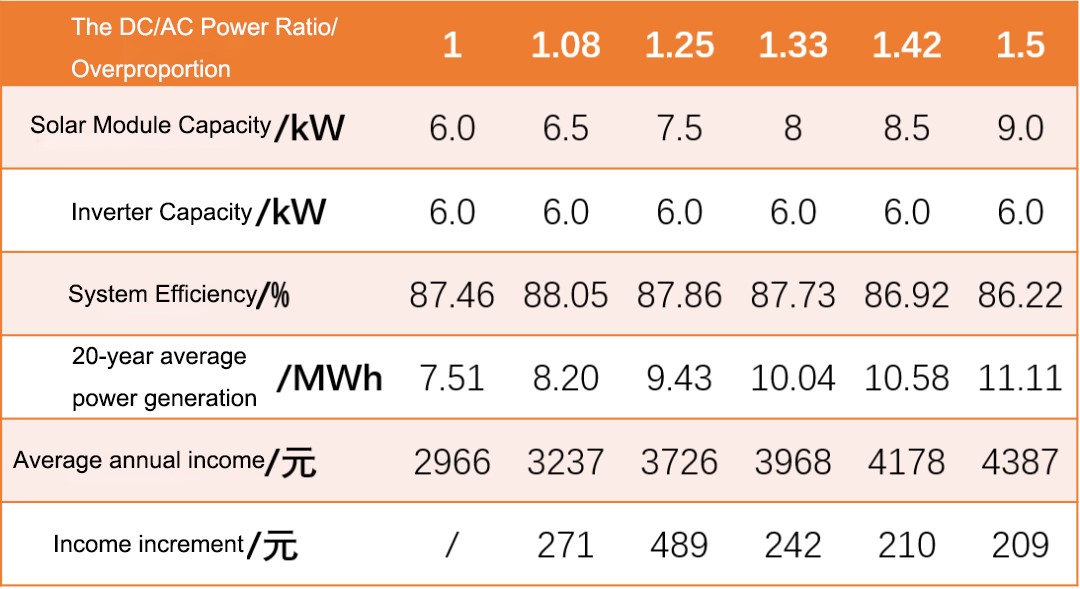
System efficiency and annual power generation with different capacity ratios
2.2 power generation and revenue
According to the system efficiency under different over-provisioning ratios and the theoretical decay rate of the modules in 20 years, the annual power generation under different capacity-provisioning ratios can be obtained. According to the on-grid electricity price of 0.395 yuan/kWh (the benchmark electricity price for desulfurized coal in Shandong), the annual electricity sales revenue is calculated. The calculation results are shown in the table above.
2.3 Cost analysis
The cost is what users of household photovoltaic projects are more concerned about.Among them, photovoltaic modules and inverters are the main equipment materials, and other auxiliary materials such as photovoltaic brackets, protection equipment and cables, as well as installation-related costs for project construction.In addition, users also need to consider the cost of maintaining photovoltaic power plants. The average maintenance cost accounts for about 1% to 3% of the total investment cost. In the total cost, photovoltaic modules account for about 50% to 60%. Based on the above cost expenditure items, the current household photovoltaic cost unit price is roughly as shown in the following table:
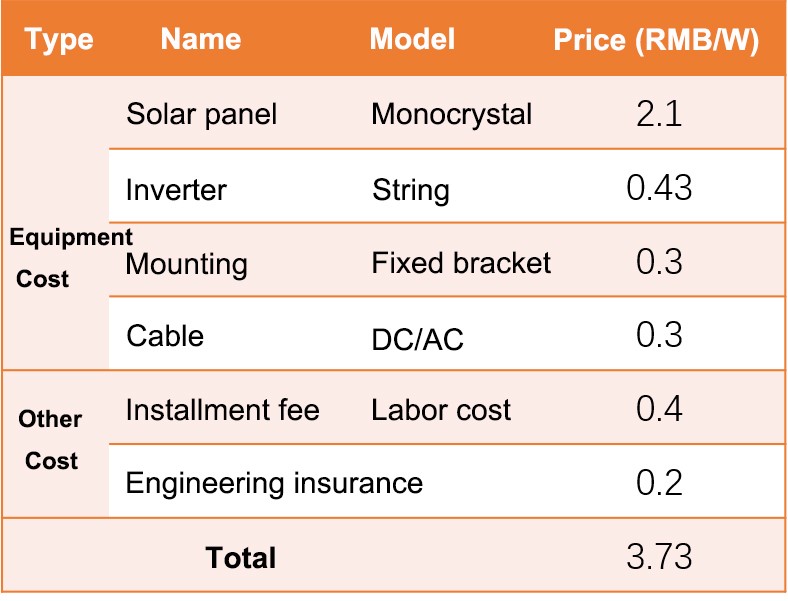
Estimated Cost of Residential PV Systems
Because of the different over-provisioning ratios, the system cost will also vary, including components, brackets, DC cables, and installation fees. According to the above table, the cost of different over-provisioning ratios can be calculated, as shown in the figure below.
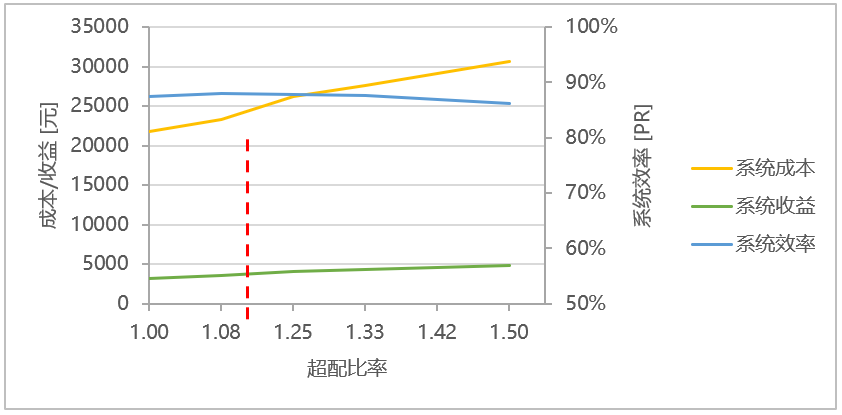
System Costs, Benefits and Efficiencies under Different Overprovisioning Ratios
03
Incremental benefit analysis
—
It can be seen from the above analysis that although the annual power generation and income will increase with the increase of the over-provisioning ratio, the investment cost will also increase. In addition, the above table shows that the system efficiency is 1.1 times more Best when paired.Therefore, from a technical point of view, a 1.1x overweight is optimal.
However, from the perspective of investors, it is not enough to consider the design of photovoltaic systems from a technical perspective. It is also necessary to analyze the impact of over-allocation on investment income from an economic perspective.
According to the investment cost and power generation income under the above different capacity ratios, the kWh cost of the system for 20 years and the pre-tax internal rate of return can be calculated.
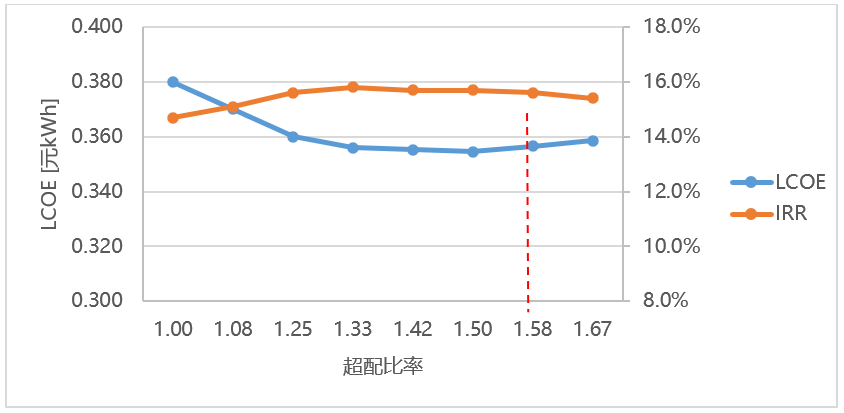
LCOE and IRR under different overprovisioning ratios
As can be seen from the above figure, when the capacity allocation ratio is small, the power generation and revenue of the system increase with the increase of the capacity allocation ratio, and the increased revenue at this time can cover the extra cost due to over allocation.When the capacity ratio is too large, the internal rate of return of the system gradually decreases due to factors such as the gradual increase in the power limit of the added part and the increase in line loss. When the capacity ratio is 1.5, the internal rate of return IRR of system investment is the largest. Therefore, from an economical point of view, 1.5:1 is the optimal capacity ratio for this system.
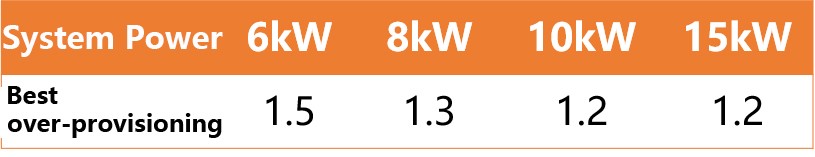
Through the same method as above, the optimal capacity ratio of the system under different capacities is calculated from the perspective of economy, and the results are as follows:
04
Epilogue
—
By using the solar resource data of Shandong, under the conditions of different capacity ratios, the power of the photovoltaic module output reaching the inverter after being lost is calculated. When the capacity ratio is 1.1, the system loss is the smallest, and the component utilization rate is the highest at this time.However, from an economical point of view, when the capacity ratio is 1.5, the revenue of photovoltaic projects is the highest. When designing a photovoltaic system, not only the utilization rate of components under technical factors should be considered, but also the economy is the key to project design.Through the economic calculation, the 8kW system 1.3 is the most economical when it is over-provisioned, the 10kW system 1.2 is the most economical when it is over-provisioned, and the 15kW system 1.2 is the most economical when it is over-provisioned.
When the same method is used for the economic calculation of capacity ratio in industry and commerce, due to the reduction of the cost per watt of the system, the economically optimal capacity ratio will be higher. In addition, due to market reasons, the cost of photovoltaic systems will also vary greatly, which will also greatly affect the calculation of the optimal capacity ratio. This is also the fundamental reason why various countries have released restrictions on the design capacity ratio of photovoltaic systems.
Post time: Sep-28-2022